It’s around this time of the year that all superannuation funds report their performances and it can be challenging to sensibly interpret this information; including how it compares with your own fund performance.
Labels can be confusing, so terms like Balanced and Growth can be interpreted differently. It’s far better to use precise language where ‘apples can be compared with apples’.
Below are the top 10 best performing Growth funds for the 2025 Financial Year. These funds were all in the category with 61% to 80% in Growth-Oriented investments, and the remainder in Defensive investments.
Table 1
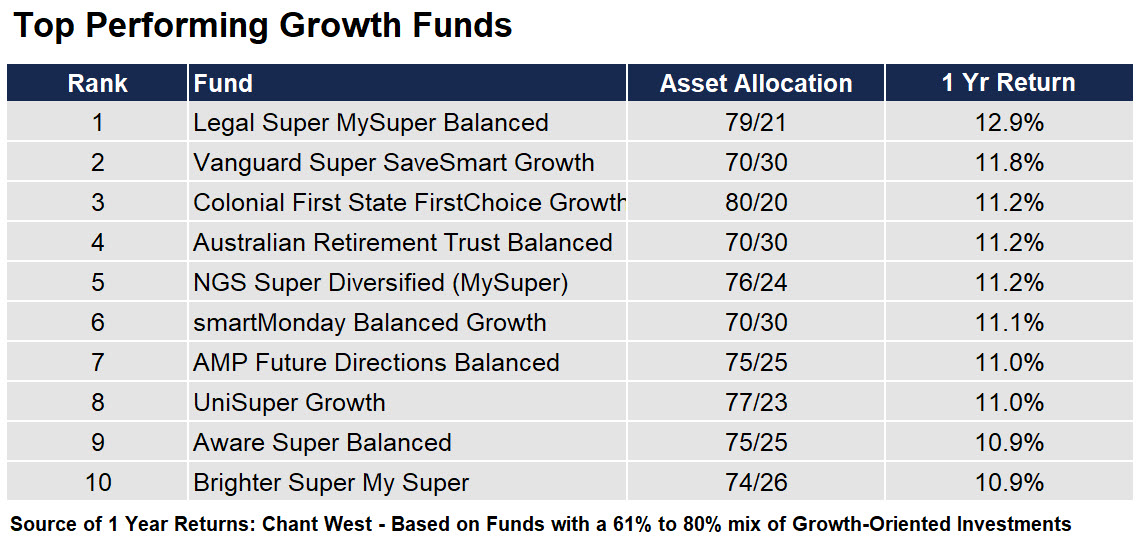
To note, there are some industry super funds that tend to classify 50% of their Property and Infrastructure exposure as Defensive, rather than 100% as Growth assets, as we typically would disclose these asset classes.
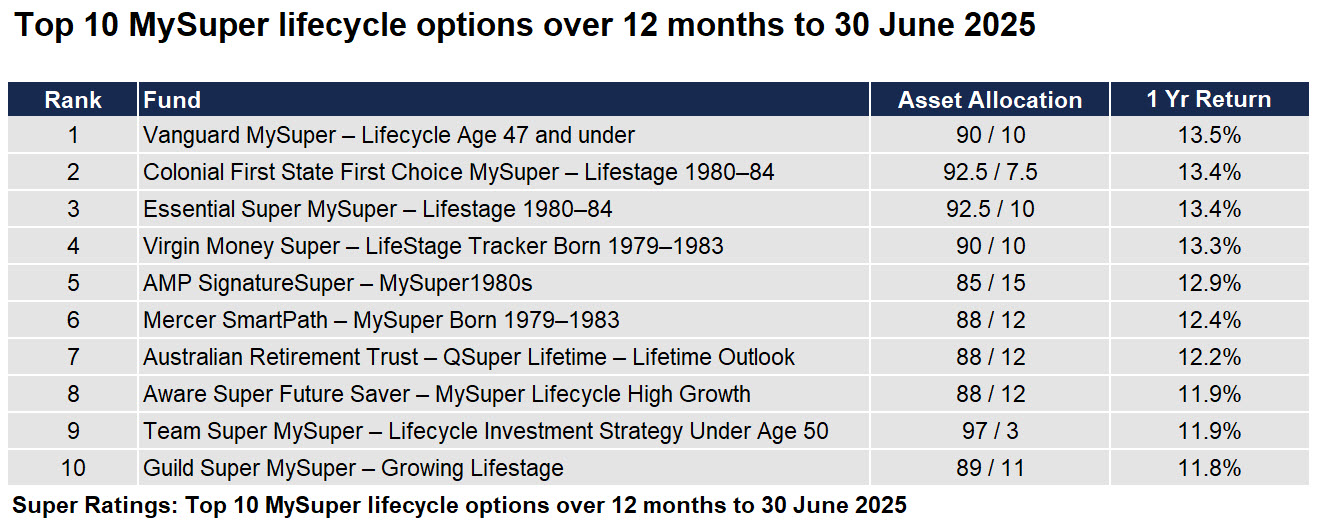
How did some of the MySuper (Default) funds perform?
Bear in mind that the asset allocation of the superannuation funds in Table 2 below varies significantly from Table 1 above. All of the Top 10 MySuper options have an asset allocation of 85% Growth / 15% Defensive or higher. In other words, during the 2025 financial year, the higher the level of Growth Assets in the portfolio, the higher the performance.
Table 2
So how did Australia’s largest (AustralianSuper), and second largest (Australian Retirement Trust) Super Funds do?
‘AustralianSuper has reported a 9.52% return for its Balanced super option for the 2024–25 financial year, as markets delivered another year of strong performance despite the complex investing environment.
AustralianSuper’s Choice Income Retirement Balanced option also posted a solid return of 10.41%, while the High Growth super option recorded a return of 10.61% for the year to 30 June 2025.
Meanwhile, Australia’s second-largest super fund, Australian Retirement Trust (ART), outperformed AustralianSuper over this financial year, with returns of 11.2% and 11.9% for its balanced pool option and higher growth pool option.’
Source: SuperReview: AustralianSuper delivers strong returns despite complex investment backdrop | Super Review
So how do these returns compare to our Client’s Portfolios?
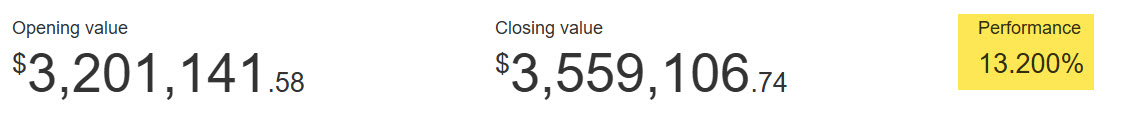
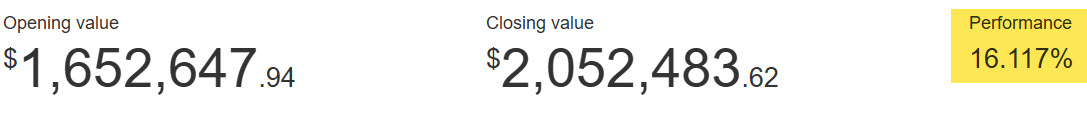
As a means of illustration, we have included 2 of our clients’ actual performances over the past 12 months to the 30 June 2025 whose portfolios were invested between 61% to 80% in Growth assets and therefore comparable to Table 1 above.
It should be noted that our returns are calculated on a money weighted basis which is the most accurate method of calculating performances, as it measures the timing of each cash flow whether it’s an inflow or an outflow.
These returns are net of both superannuation tax (where applicable) and net of all fees including our advice fees.
In the first example below, there were also cash outflows on the portfolio and still an impressive 13.20% (net of our advice fee and taxes), while the second portfolio returned 13.212%. Clearly, the returns do vary depending on the asset allocation of each of the portfolios.
Examples of accounts/portfolios between 61% and 80% Growth Oriented Assets
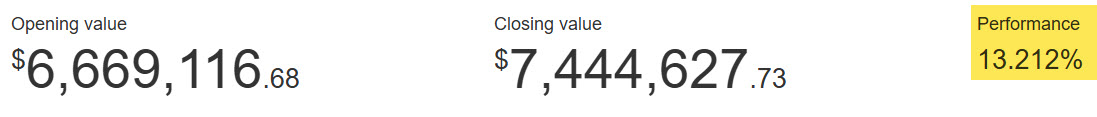
The performances below are for client’s accounts/portfolios that had a higher asset allocation than 80/20 (Growth/Defensive) and are therefore comparable to the Top 10 MySuper Options per Table 2 above.


Reflection
The purpose of this note isn’t just to highlight and demonstrate that our performances for this year were significantly higher than those of the best performing funds, but more to explain some of the meaningless terminology noted in the press without context.
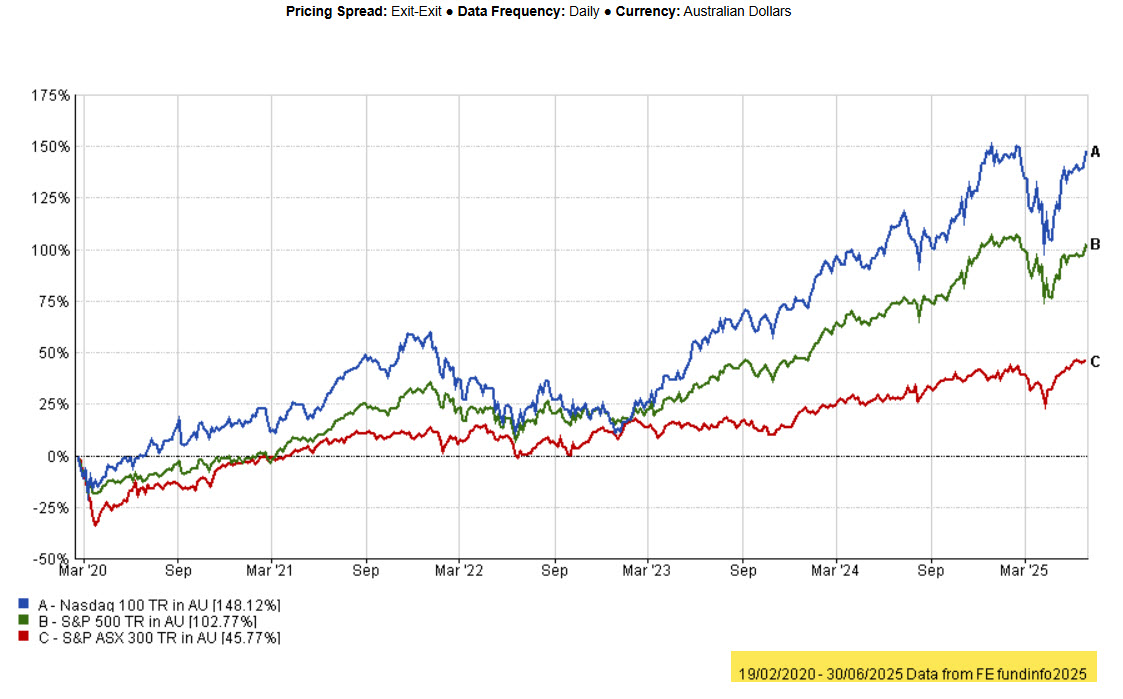
There is no doubt that our clients’ portfolios in general have benefited from:
- Being significantly overweight International Equities relative to Australian Equities.
- Having an unhedged currency position for International Equities.
- Being overweight US Equities with a bias towards technology.
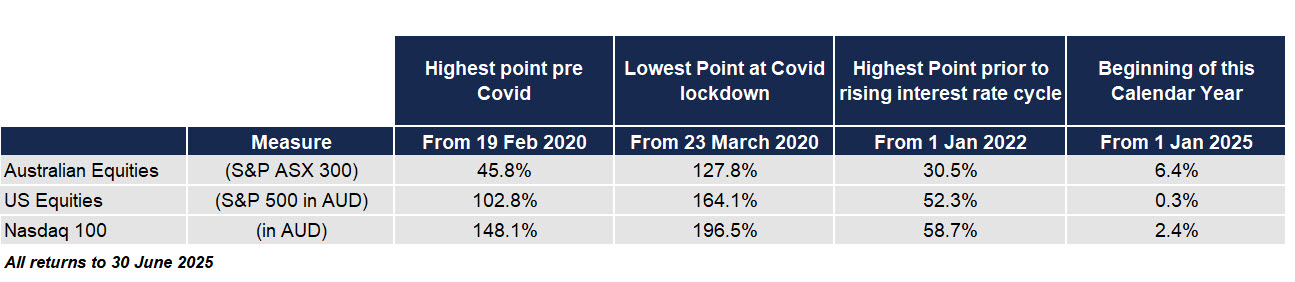
Table 3 below illustrates what a rocky and roller-coaster ride the last 5 years has been since Covid. Below are cumulative returns to 30 June 2025. The 1st and 3rd column represent the highest points in the cycle at that time. The main take out from this table is that:
- There are no negative returns, and
- If a crisis happens, it’s best to stay invested and ride it out.
Table 3:
In Conclusion
Investing isn’t a sprint, but rather a marathon. Our goal is to provide counsel, advice and coaching to our clients whose financial success requires the specific expertise we have. We are privately owned and therefore have no pressure to sell or recommend solutions which may not be in your best interests.
Please note:
- This communication has been prepared for the purpose of providing general information, without taking any account of your objectives, financial situation or needs.
- You should – before making any investment-related decisions – consider the appropriateness of the information in this document, and seek our specific advice – having regard to your own objectives, financial situation and needs.