Following the end of each tax year and toward the end of July, annual super fund performances are paraded in announcements, table rankings and commentary in the media.
The beauty parade – as reflected in published table rankings – is probably the worst source of confusion for the general public – as we explain below.
This year, Australian Super was first out – with an announcement that their Balanced Fund achieved a return of 8.6% for the year ended 30 June 2019.
Published or reported portfolio returns are primarily a function of:
- Asset Allocation;
- The reported performance of the underlying investments.
Asset Allocation
We refer here more specifically to the allocation of the fund assets to Growth Assets vs Defensive Assets:
- A fund that has a high allocation to Growth Assets carries more investment risk (higher short to medium term volatility); with the reward of expected superior returns over time – when compared to a portfolio with a lower allocation to growth assets.
- Different investors have different risk profiles and objectives, and therefore have portfolios with different asset allocations:
- The younger superannuation member with a very long investment time horizon may be in a 100% Growth fund; whereas
- An 80-year-old retiree may have 30% allocated to Growth.
- Generally speaking, portfolio asset allocations are described as follows:
- 30% – 50% Growth and 70% – 50% Defensive Assets Conservative, or Capital Stable;
- 50% – 65% Growth Assets Balanced;
- 70% – 80% Growth Assets Growth or Balanced Growth;
- 85%+ High Growth or Aggressive.
Clearly, it is not appropriate to compare the performance of a super fund with a High Growth asset allocation to a fund with a Balanced, or Conservative asset allocation.
The next problem that arises in the beauty parade tables lies in the Product Descriptions.
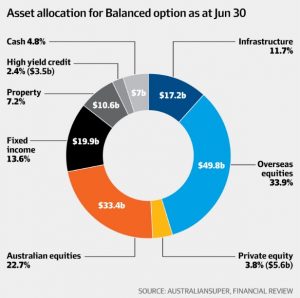
For Example: The Australian Super Balanced Fund, referred to at the start of the article – which you would expect to have 50% to 65% in Growth Assets based on its product description – has in fact approximately 80% in Growth Assets.
Australian Super – Balanced Fund – Asset Allocation as at 30 June 2019
When the comparison tables are published later this month, it is important to remember to compare ‘apples with apples’ – go online and compare similar asset allocations to get a more accurate point of comparison.
Reported Performances
If a fund owned a single listed share – it would be easy to work out the return on the investment from one date to the next – as total returns will comprise the sum of declared dividends, together with the change in the share price.
When fund assets comprise listed investments on a public, regulated stock exchange; the valuation of the underlying investments is determinable, transparent and absolute.
Where fund assets comprise holdings in unlisted assets – such as private companies through private equity, direct property, social assets, loans etc. – the valuations associated with these investments are not absolute, not publicly available, lack transparency and subject to ‘ranges’ within which the valuation can be argued as being reasonable.
Yes – all funds are highly regulated and audited – and we are certain that best endeavours are used to ensure that the reported performance of these investments fairly represents the return achieved during the reporting period. However, to the extent that there is some variability available in the reporting of the performance of these assets, it is not inappropriate to consider the potential for a conflict of interests.
From our perspective, we are comfortable that our strategic asset allocation used for different portfolio types – Conservative, Balanced, Growth etc., has stood the test of time against index funds which, in turn, have performed favourably against similar Retail and Industry Superannuation Funds with similar asset allocations.
We do note – as we must – that past performance cannot be relied upon as a predictor of future performance.
Happy New (Financial) Year!
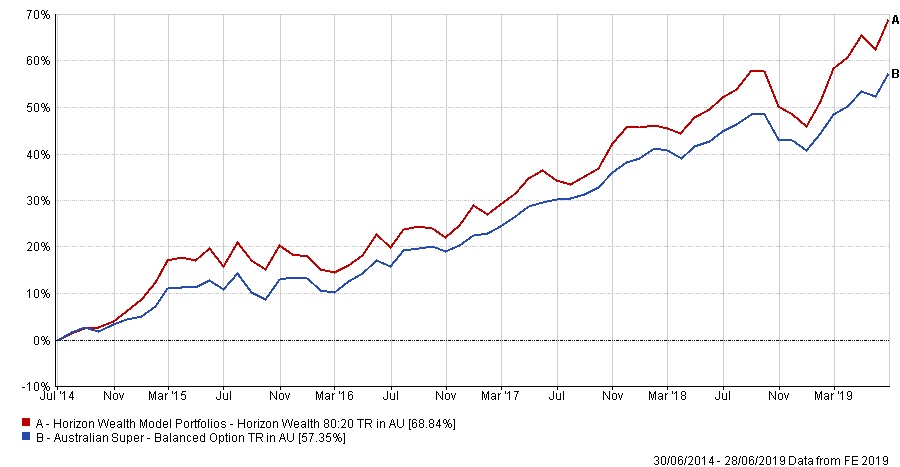
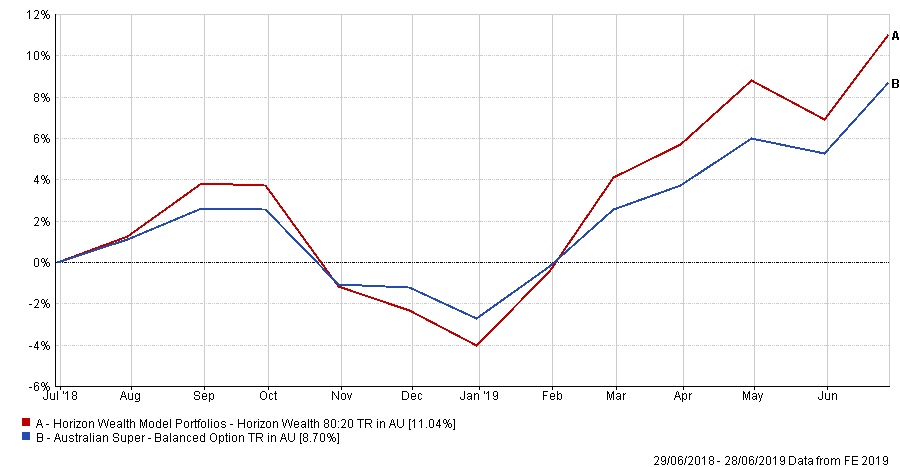
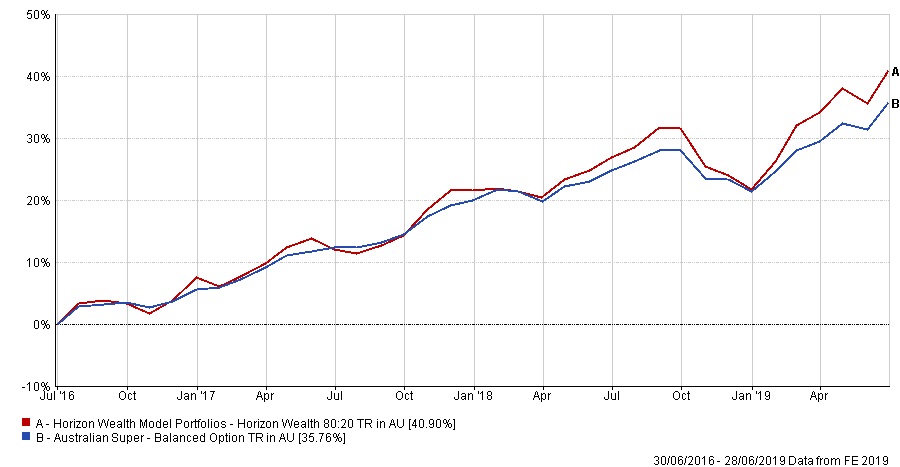
Horizon Wealth Management Strategic Asset Allocation
– Growth Portfolio (80/20) –
versus
– Australian Super Balanced Option –
1 Year – Performance
3 Year – Performance
5 Year – Performance