Toward the end of July, annual super fund performances will be paraded in announcements, table rankings and commentary in the media.
The beauty parade – as reflected in published table rankings – can be a source of confusion for the general public – as we explain below.
The returns associated with any portfolio – whether held personally, jointly, in superannuation, a trust or other entity – will be a function of:
- The underlying asset allocation (the % of the portfolio allocated to Growth Assets vs Defensive Assets);
- The definitions applied to Growth and Defensive assets; and
- Whether the portfolio includes unlisted assets.
In order to assist you in your assessment of your fund, we provide some clarity regarding the industry jargon, below:
- Growth vs Defensive Assets:
- Growth Assets – comprise investments which display higher volatility in the short-term, and which are expected to deliver higher returns in the long-term (as a reward for the risk taken).
- Defensive Assets – comprise low volatility assets which display lower volatility generally, and which are expected to deliver modest returns over the short, medium and long-term time horizons.
Portfolios with a higher proportion of Growth Assets will be considerably more volatile (as seen through the recent correction) than those portfolios with a higher proportion allocated to Defensive Assets. It may be that in the short- term, a Conservative (ie predominantly defensive) Fund may outperform a High-Growth Fund, whereas in the longer term the High-Growth Fund will generally outperform the Conservative Fund.
- Growth and Defensive asset definitional inconsistencies:
- Growth assets – typically comprise equities, property, infrastructure, private equity and commodities (e.g. Gold).
- Defensive assets – typically comprise cash, bank deposits and low credit risk debt securities – such as Australian Government bonds and some bank debt securities (but not hybrids).
Some superannuation funds allocate property and infrastructure investments to Defensive Assets.
- Superannuation product description inconsistencies:
- When is a “Balanced Fund” NOT a “Balanced Fund”?!
A problem with performance comparisons arises when one superannuation fund classifies property and infrastructure as Defensive Assets, and another superannuation fund classifies these assets as Growth Assets.
In this case, the nominally “Balanced” Fund – with 60% Growth assets and 40% Defensive assets; with half of the Defensive assets comprising property and infrastructure – is actually a Growth Fund. This fund has performance and volatility characteristics more in common with an 80% Growth and 20% Defensive Fund.
This Balanced Fund should be compared with other funds in the Growth category, and not against funds in the Balanced Category.
- Portfolios with unlisted assets:
- Portfolios comprising a material proportion of unlisted assets (some superannuation fund portfolios have as much as 20%) present problems when assessing performance.
- The value of well-traded listed securities is clear. Price discovery occurs continuously, and the value of a security at any time is the last price paid between a willing buyer and willing seller. Prices are transparent and verifiable.
- Unlisted assets are typically revalued at least annually – sometimes more frequently – with valuations determined either by a professional valuer, or by Directors of the Investor or Investee company itself.
For example: Listed commercial property shares such as Dexus, Goodman, Mirvac etc. are traded on the ASX with sales prices and volumes recorded. However, a direct, unlisted holding in a specific commercial property is more difficult to value. The valuer will look at a large number of variables in assessing value – including the availability of a willing buyer, comparable property sales, yields, interest rates etc.
Any valuation represents the midpoint of a range of possibilities, and for the superannuation fund investor – is not transparent nor determinable.
So, when listed property shares decrease by 40% during a market correction, but a superannuation fund valuator values a specific commercial property, 5 or 10% lower just after the correction – who is to say that the new valuation is correct? Who determines? The only time when the true value of the unlisted property is determinable is when a sale takes place.
“Valuation” – becomes an issue when the portfolio manager has influence or control over the value of constituent portfolio investments. “Hostplus reverses property write-downs – Just in time for the end of the financial year.” – Australian Financial Review; July 5, 2020.
These valuations may be (we are not suggesting they are) used to boost performances for table rankings.
Unfortunately, there are so many variables when executing and assessing an investment strategy that it is often very difficult for the average investor to compare products effectively, and make informed decisions.
From our perspective, we keep things simple and transparent.
- Growth Assets are growth assets, and growth portfolios are growth portfolios.
- Where we do use unlisted funds – we have no influence or control over the associated fund manager – so value disclosed is the value.
Why this all matters.
As mentioned, Growth assets have different risk / return characteristics when compared with genuinely Defensive assets.
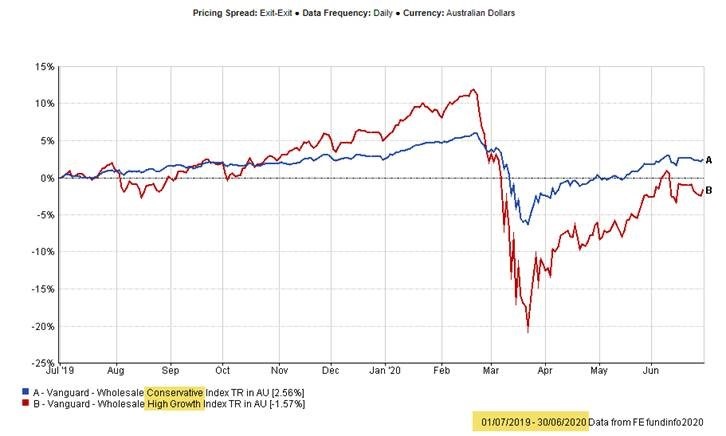
We show in Graph 1 below, how a High-Growth portfolio displays higher volatility over a Conservative portfolio during a market correction, and may under-perform a Conservative portfolio in the short-term.
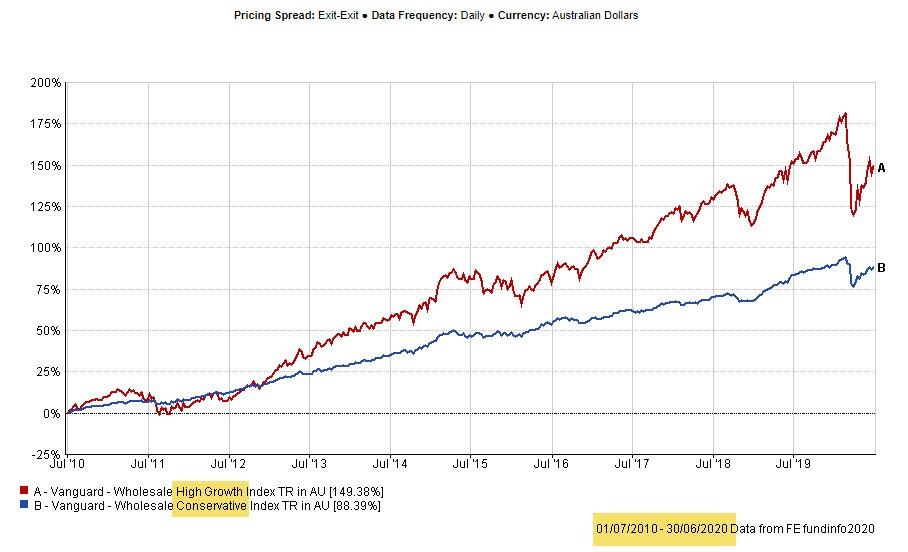
We show in Graph 2, how a High-Growth portfolio outperforms a Conservative portfolio over the longer-term. There must be a return for added risk (volatility) for investors to be drawn to the riskier securities.
Graph 1.
Risk and Return
Tax Year: 1 July 2019 to 30 June 2020
90% Growth Assets (High-Growth) vs 30% Growth Assets (Conservative) Portfolios
Total Return (Income and Capital)
Graph 2.
Risk and Return
Tax Years: 1 July 2010 to 30 June 2020 (10 Years)
90% Growth Assets (High-Growth) vs 30% Growth Assets (Conservative) Portfolios
Total Return (Income and Capital)
We are comfortable that our strategic asset allocation used for different portfolio types – Conservative, Balanced, Growth etc., has stood the test of time against proxy index funds which, in turn, have performed favourably against comparable Retail and Industry Superannuation Funds.
We do note that past performance cannot be relied upon as a predictor of future performance.