It’s around this time of the year that all superannuation funds start reporting their performances and it can be challenging to sensibly interpret this information; including how it compares with your own fund performance.
Unfortunately labels can be confusing so terms like Balanced and Growth can be interpreted differently. It’s far better to use precise language where ‘apples can be compared with apples’.
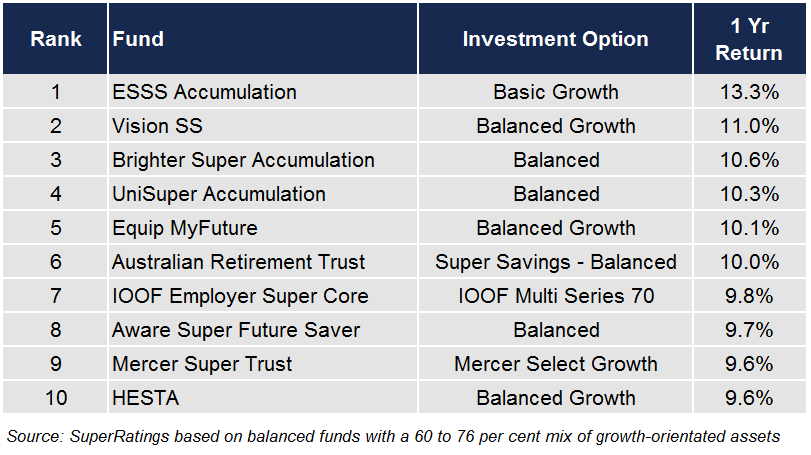
Below are the top 10 best performing funds for One Year, in the Year to 30 June 2023 – these funds were all in the category with 60% to 76% in growth-oriented investments, and the remainder in Defensive investments.
Further Commentary From Super Review 21 July 2023:
Delivering some 8.9% returns pa, the Hostplus Balanced option continues to be the top-performing Growth fund in Australia in the last decade (10 years). This is well over the median of 7.5%, according to Chant West’s analysis. Earlier this week, Hostplus announced its Balanced option returned 8% for the FY2022-23 financial year.
Australian Super – their ‘Balanced’ fund’s asset allocation is below. There are some industry super funds that tend to classify 50% of their Property and Infrastructure exposure as Defensive (rather than 100% as Growth assets) – refer below.
Source: The top 10 super funds of the last 10 years
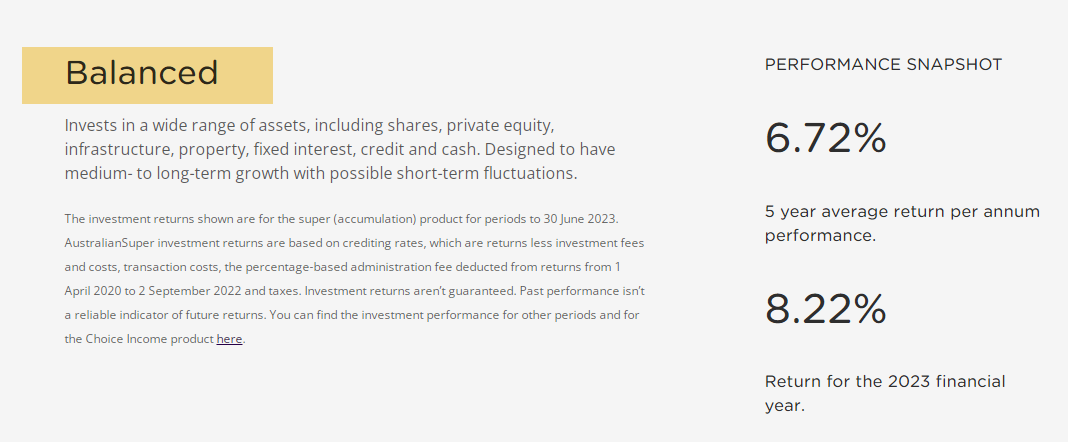
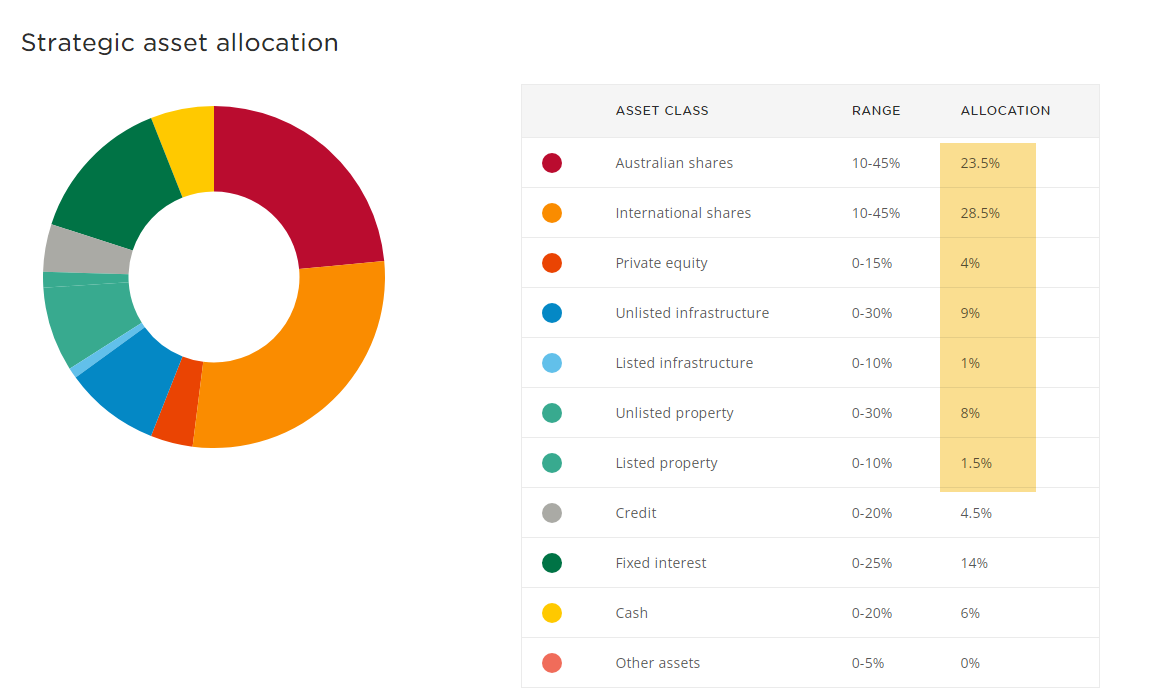
Source: AustralianSuper Investment Options
So How Do These Returns Compare To Our Client’s Portfolios?
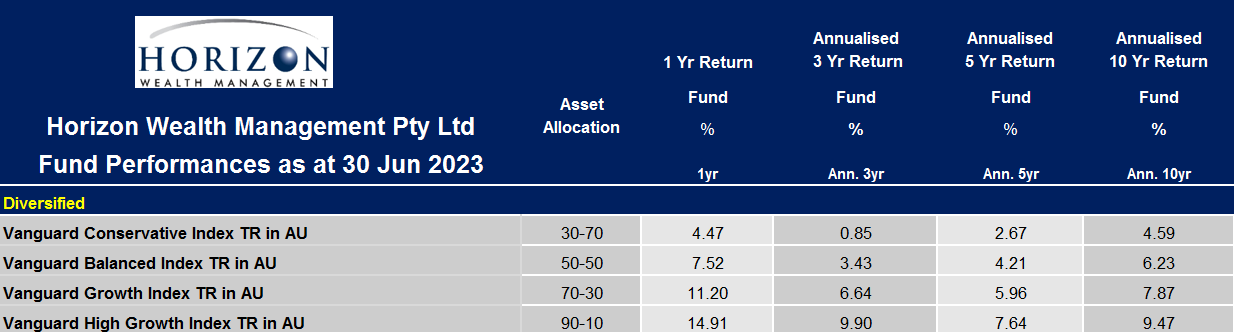
First of all, it’s worth reviewing the diversified range of the Vanguard funds which we use for certain client’s circumstances, as well as benchmark to our returns.
For the purposes of this discussion; firstly Vanguard use the term Balanced to describe a 50/50 (Growth/Defensive) Investment option so you can see how confusing labels (without a proper explanation) can be. We choose to avoid this ambiguity by disclosing the actual asset allocation of each fund.
If one looks at the Vanguard Growth Fund and Vanguard High Growth Fund in the table below, whose asset allocations are 70/30 (Growth/Defensive) and 90/10 (Growth/Defensive) respectively – one can see that either the Growth Fund, or the average of these 2 funds correlates fairly closely to a number of the ‘top funds’ asset allocations above. In this case, the performance of the Vanguard Growth Fund compares very favourably at 11.20% for the one year return to 30 June 2023. It should be noted that superannuation tax should be applied to these Vanguard returns to again compare ‘apples vs apples’. If one assumes an earnings rate of 3% and a superannuation tax rate of 15%, it would be appropriate to reduce these returns by approximately 0.5%. Further, one could also reduce these returns further by an estimated administration fee of approximately 0.5%.
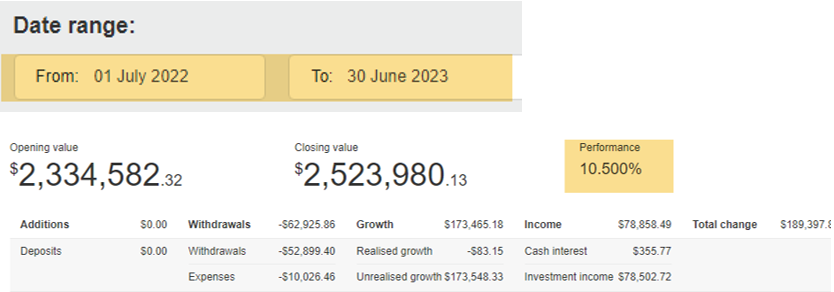
We then reviewed 2 of our clients’ actual performances over the past 12 months to the 30 June 2023 whose portfolios were invested on a 70/30 basis.
These returns are net of both superannuation tax and also net of all fees including our advice fees.
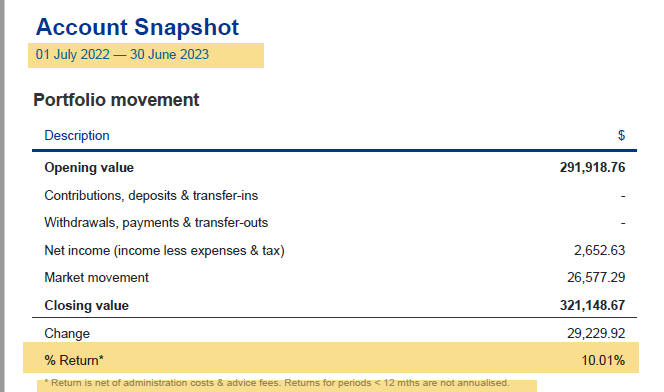
In the example below, there was also cash outflows on the portfolio and still an impressive 10.5% return after all fees (including our advice fee) and taxes.
Valuations of Unlisted Investments
On another point which has gained press recently; whilst we don’t have an issue with investing in unlisted investments – what we do have concerns with is that some of the investments in these funds have appeared over the years to be overvalued at certain points in the cycle, thereby possibly providing a misleading advantage over other Super Providers who invest only in listed investments.
AFR – July 20th 2023

AFR – July 17th 2023
Below is the asset allocation of Vision Super’s Balanced Growth Fund which was 2nd in the performance charts above. Note that nearly 20% of its assets are unlisted.
The regulators have correctly raised justifiable concerns about whether unlisted investments are correctly valued.
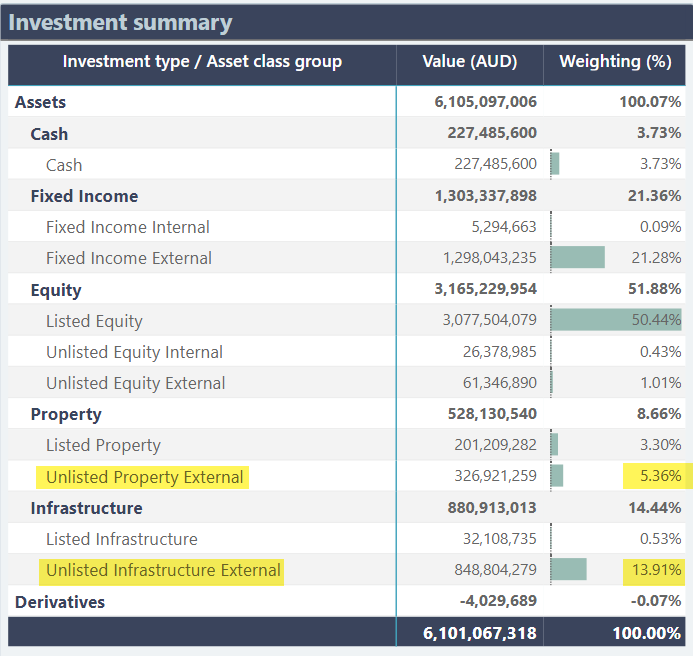
Source: Vision Super Portfolio Holdings
Reflection
The purpose of this note wasn’t just to highlight and demonstrate that our performances were at the very least on par with those of the best of the large funds, but more to explain some of this meaningless terminology noted in the press without context.
There is no doubt that our clients’ portfolios in general have benefited from:
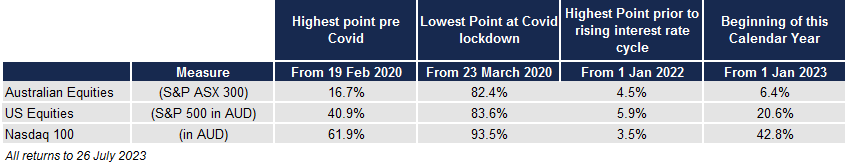
- Being significantly overweight International Equities relative to Australian Equities.
- Having an unhedged currency position for International Equities.
- Being overweight US Equities with a bias towards technology.
- Being underweight Property.
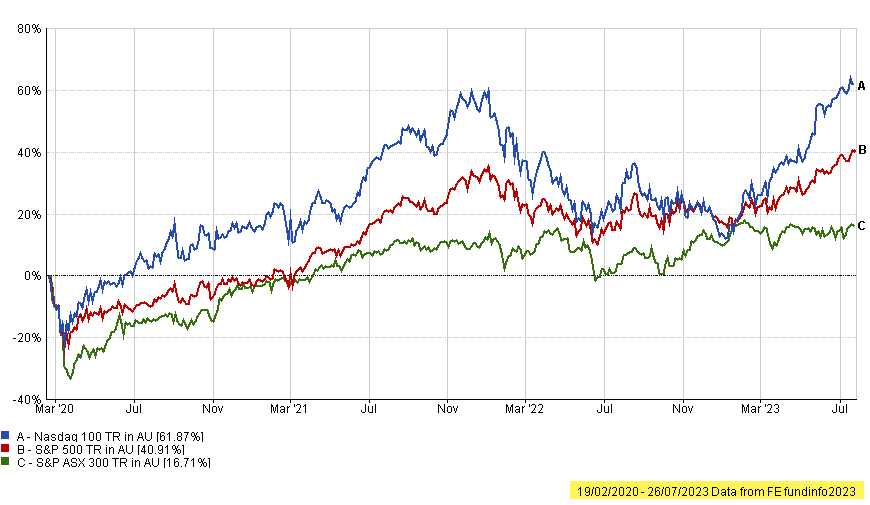
The table below shows what a rocky and roller-coaster ride the last 3 years have been since Covid. Below are cumulative returns to 26 July 2023. The 1st and 3rd column represent the highest points in the cycle at the time.
In Conclusion
Investing isn’t a sprint, but rather a marathon. Our goal is to provide counsel, advice and coaching to our clients whose financial success requires the specific expertise we have. We are privately owned and therefore have no pressure to sell or recommend solutions which may not be in your best interests.
Please note:
- This communication has been prepared for the purpose of providing general information, without taking any account of your objectives, financial situation or needs.
- You should – before making any investment-related decisions – consider the appropriateness of the information in this document, and seek our specific advice – having regard to your own objectives, financial situation and needs.